Advanced Divergence Detector
MomentumAutomatically spot regular and hidden divergences between price and RSI, MACD, Stochastic or OBV, with trendlines and labels drawn on your chart.
The Logic & Theory
Divergence occurs when the price of an asset moves in the opposite direction of a technical momentum oscillator. Regular Divergence (Price making Higher Highs while the Oscillator makes Lower Highs) indicates a waning trend and a potential reversal. Hidden Divergence (Price making Higher Lows while the Oscillator makes Lower Lows) is often read as a continuation signal, suggesting the underlying trend may be preparing for another push. Divergences can fail, especially in strong trends, so they are best used as one piece of information rather than a stand-alone signal.
How Our Custom Tool Helps
Spotting divergence manually requires a trained eye and constant chart monitoring. This Pine Script v6 indicator automates the process. You choose one oscillator (RSI, MACD, Stochastic or OBV), and the script compares the latest two pivots of that oscillator with price. When it finds a regular or hidden divergence it draws a trendline and a label on your price chart: Bull and Bear for regular divergence, H Bull and H Bear for hidden divergence. A divergence is confirmed only after the pivot has been followed by a set number of closed candles (5 by default), so the label appears that many candles after the pivot itself. Once drawn, it does not move or disappear, so it does not repaint. The indicator shows that a divergence exists, not what price will do next. It is not a trading signal or financial advice.
Interactive Demo: See the Difference
Drag the slider left and right to see how this tool transforms your chart.
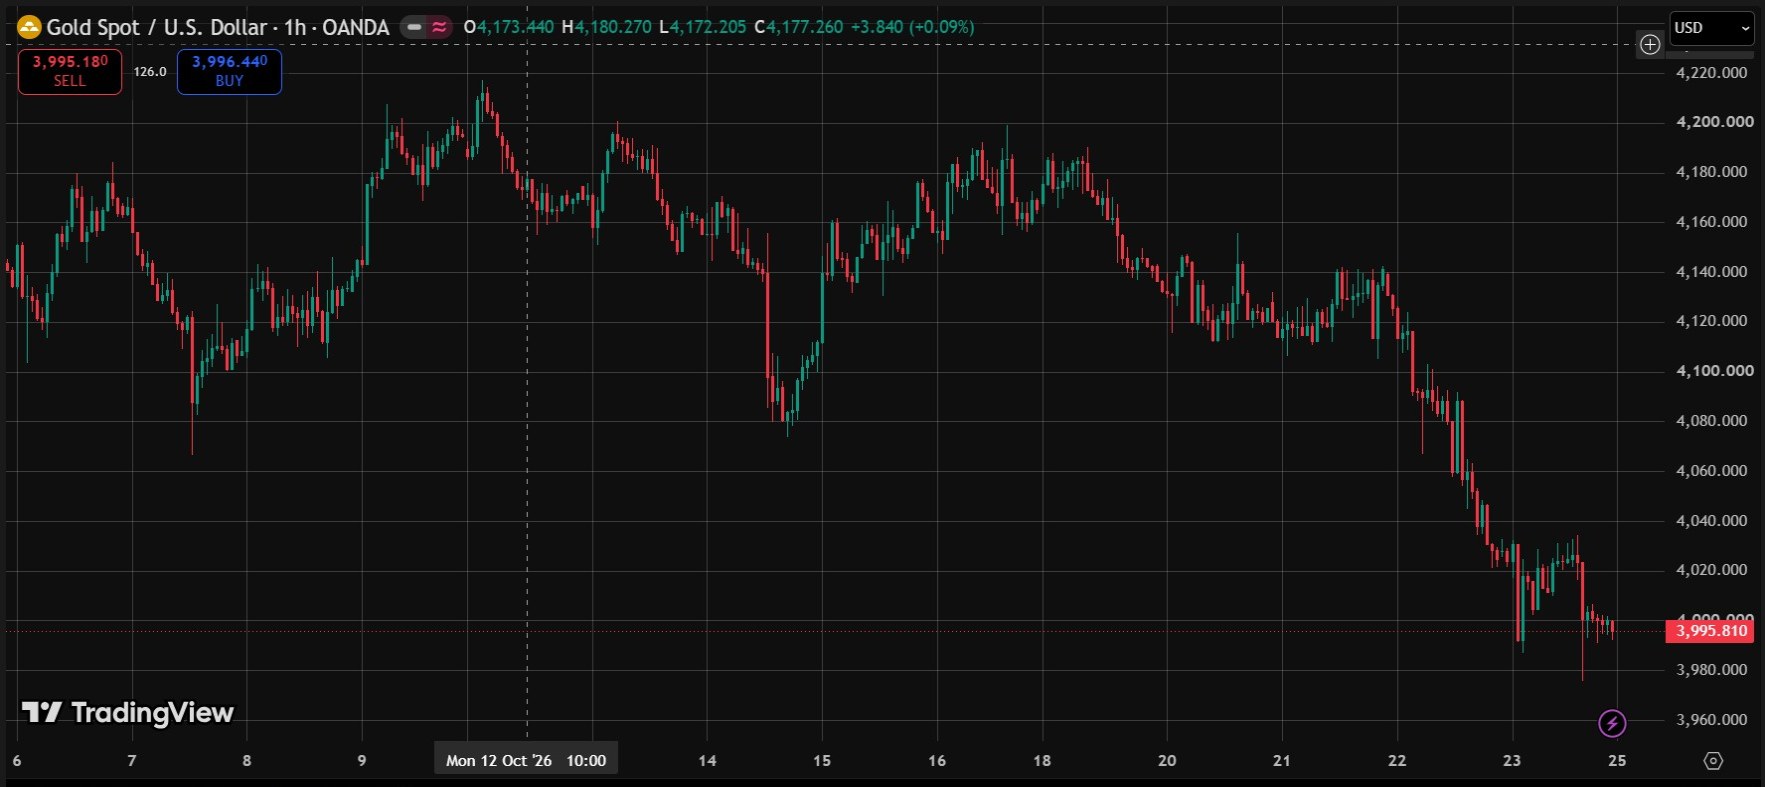
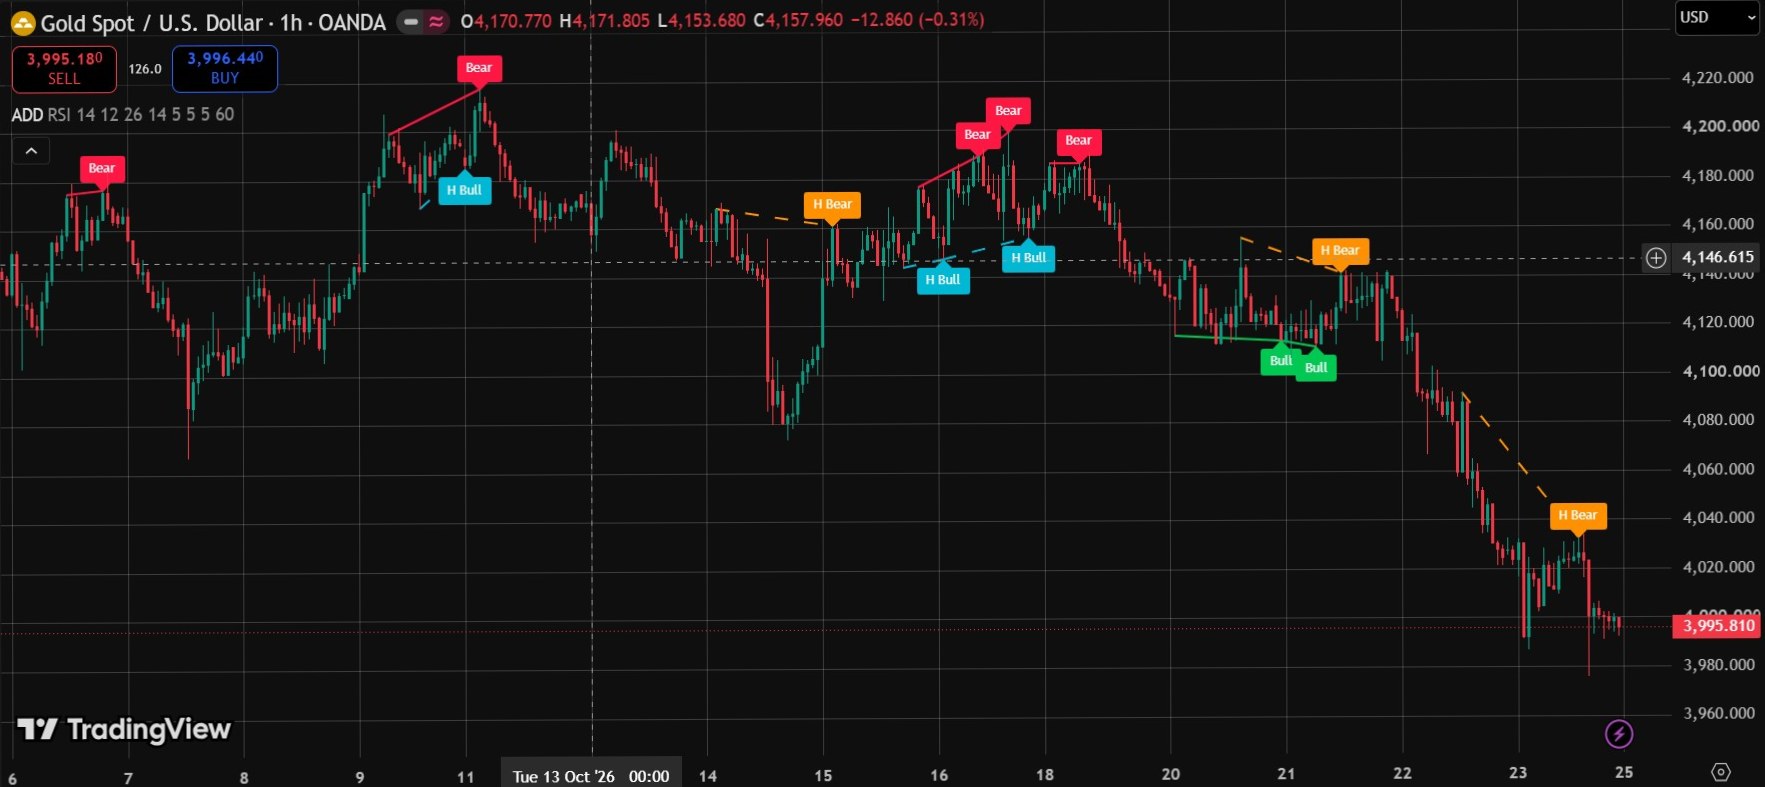
Real screenshots from a live TradingView chart. For education only, not a trading signal.
Premium Features & Alerts
- Detects regular and hidden divergence, bullish and bearish
- Choose the oscillator: RSI, MACD, Stochastic or OBV
- Trendlines and labels drawn automatically on the price chart
- Adjustable pivot size and distance between pivots
- Confirmed after the pivot (5 closed candles by default), so drawn divergences do not repaint
- Alerts for each divergence type and for any divergence, with pop-up or email chosen in TradingView
- Works on any symbol available in TradingView
Frequently Asked Questions
What is the difference between regular and hidden divergence?
Regular divergence happens when price makes a new high or low but the oscillator does not, which can show a weakening trend. Hidden divergence happens when price makes a higher low (or a lower high) while the oscillator makes a lower low (or a higher high), which is often read as a sign that the trend may continue.
Which oscillators does it support?
You can choose RSI, MACD, Stochastic or OBV.
Does the Advanced Divergence Detector repaint?
No. A divergence is confirmed after 5 closed candles by default, so the label appears that many candles after the pivot candle. Once it is drawn, it does not move or disappear.
Can I get alerts?
Yes. There is one alert for each of the four divergence types and one for any divergence. Pop-up, email or app notifications are chosen in TradingView's alert settings.
Want This Custom Script?
Get this indicator installed on your TradingView/MT5, or let us build a completely custom strategy just for you.
Size Your Trades Properly
More Custom Indicators & Scripts
5-in-1 Pro Trend Confluence + MTF Dashboard
Trend, momentum and volatility in one clean indicator: 50 & 200 EMA, RSI, MACD and ATR, plus a trend dashboard for the 5m, 15m, 1H and 4H timeframes.
Smart Money Concepts (SMC) Pro Indicator
Automatically marks Order Blocks, Fair Value Gaps (FVG) and Liquidity Sweeps on your TradingView chart, with zone-touch alerts and an optional higher-timeframe filter.
Multiple Indicator Merge
A custom-coding service: we combine several of your indicators, for example EMA, RSI and MACD, into one TradingView script.