5-in-1 Pro Trend Confluence + MTF Dashboard
Premium IndicatorsTrend, momentum and volatility in one clean indicator: 50 & 200 EMA, RSI, MACD and ATR, plus a trend dashboard for the 5m, 15m, 1H and 4H timeframes.
The Logic & Theory
A single reading is rarely enough to judge a market, so many traders look at trend, momentum and volatility together. The Exponential Moving Average (EMA) shows trend direction: the 50 EMA reacts faster, the 200 EMA shows the longer-term trend, and price trading above or below the 200 EMA gives a simple bias. The Relative Strength Index (RSI) and the Moving Average Convergence Divergence (MACD) measure momentum, which helps you see whether a move has strength behind it. The Average True Range (ATR) measures how far price typically moves, which is useful when you choose stop distances and position sizes. Finally, checking the same trend rule on several timeframes shows whether the short-term picture agrees with the bigger one.
How Our Custom Tool Helps
Why clutter your chart with five separate indicators? This script plots the 50 and 200 EMA on your chart and puts RSI, MACD, ATR and a four-timeframe trend check into one compact dashboard. You can read the trend, momentum and volatility at a glance and keep your chart clean. The indicator shows market conditions only. It does not draw buy or sell arrows and it does not place trades, so the decision always stays with you. The dashboard is live: its readings, including the Bullish or Bearish status, update with every tick and can change until the candle closes, so you always see the current picture.
Interactive Demo: See the Difference
Drag the slider left and right to see how this tool transforms your chart.
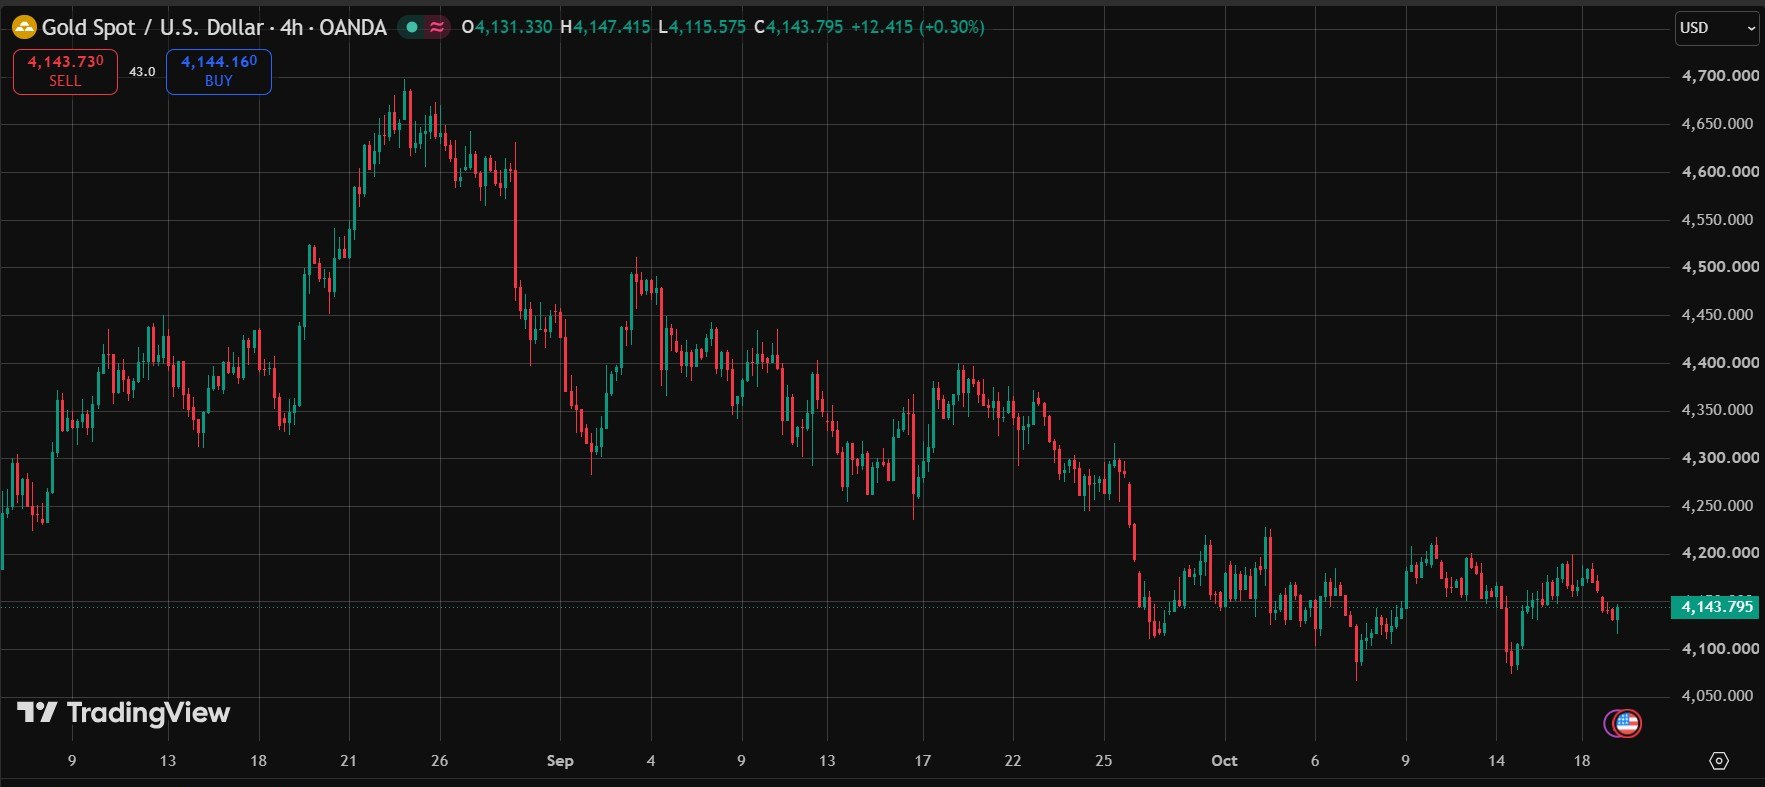
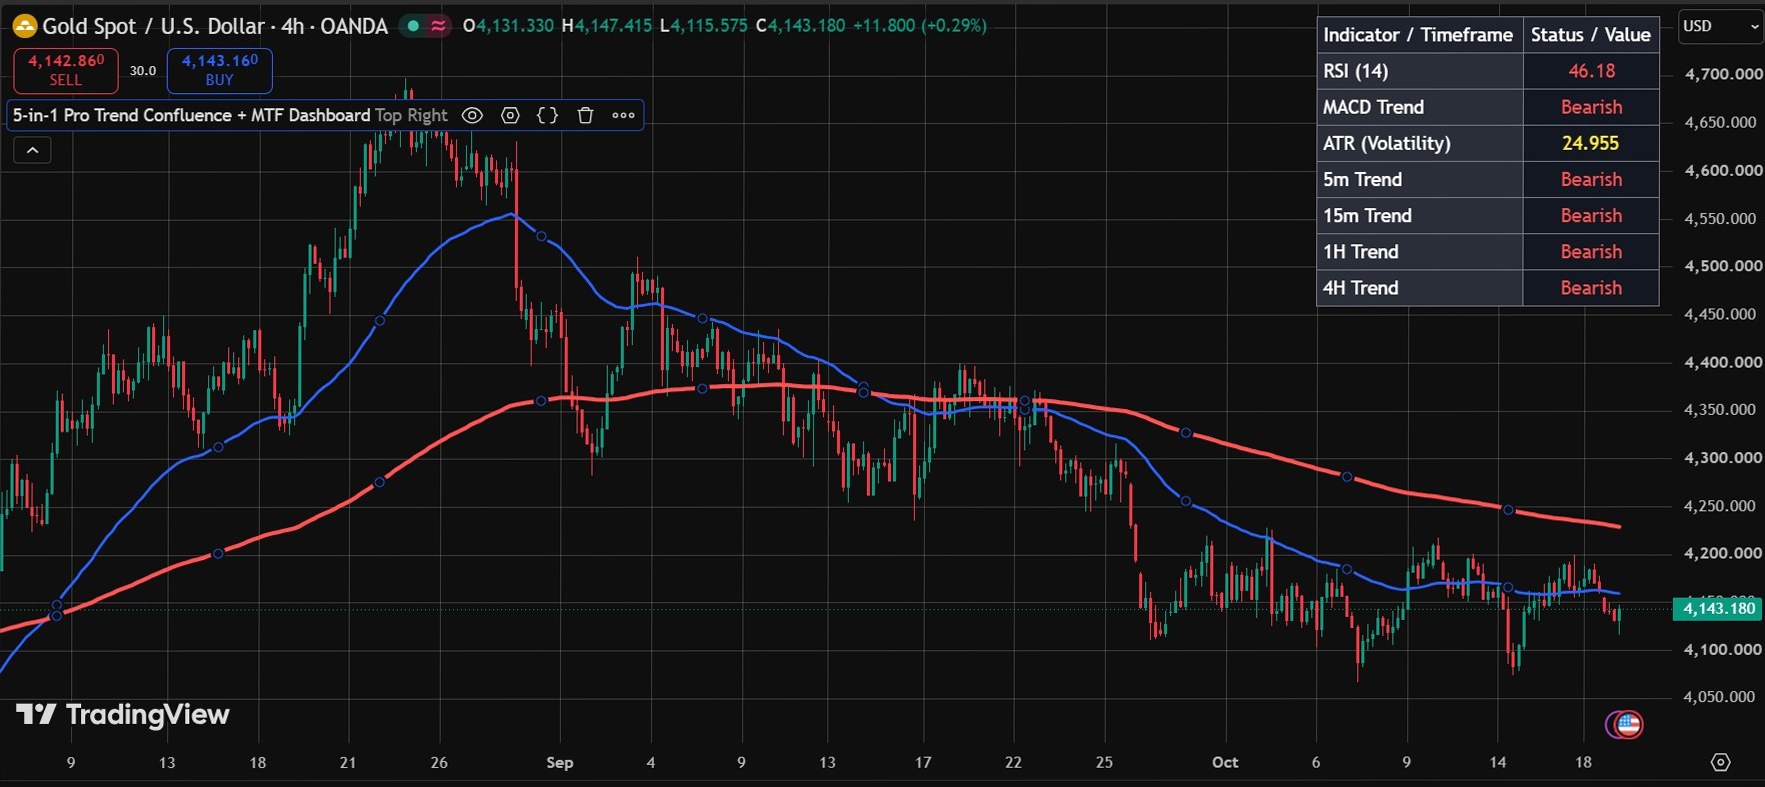
Real screenshots from a live TradingView chart. For education only, not a trading signal.
Premium Features & Alerts
- 50 & 200 EMA trend lines on your chart
- RSI (14), MACD trend and ATR (14) in one dashboard
- Trend check on 5m, 15m, 1H and 4H (price vs the 200 EMA)
- Live dashboard: readings update with every tick and are final when the candle closes
- No buy/sell arrows, so there are no past signals that can change or disappear
- Works on any symbol available in TradingView
Frequently Asked Questions
What does the 5-in-1 Pro Trend Confluence indicator show?
It plots the 50 and 200 EMA and shows RSI (14), the MACD trend, ATR (14) and a trend check for 5m, 15m, 1H and 4H in one dashboard on your chart.
Does it give buy or sell signals?
No. It shows market conditions only and draws no buy or sell arrows, so the trading decision stays with you.
Is the dashboard live?
Yes. The readings update with every tick and can change until the current candle closes. Because no buy or sell arrows are drawn, there are no past signals that can change.
Which markets does it work on?
It works on any symbol and timeframe available in TradingView.
Want This Custom Script?
Get this indicator installed on your TradingView/MT5, or let us build a completely custom strategy just for you.
Size Your Trades Properly
More Custom Indicators & Scripts
Smart Money Concepts (SMC) Pro Indicator
Automatically marks Order Blocks, Fair Value Gaps (FVG) and Liquidity Sweeps on your TradingView chart, with zone-touch alerts and an optional higher-timeframe filter.
Multiple Indicator Merge
A custom-coding service: we combine several of your indicators, for example EMA, RSI and MACD, into one TradingView script.
Multi-Timeframe Trend Dashboard
See the EMA and MACD trend of 4 timeframes (M15, H1, H4 and D1 by default) in one small table on a single chart.